

The world of cryptocurrency trading is overwhelming for a newbie. There is such a wave of terms and concepts that have to be grasped; for this reason, to get properly established, one has to get the foundational building blocks right. Probably one of the most important skills one needs to learn first is how to read cryptocurrency charts.
This guide will give you fundamental knowledge about various chart types, trading volumes, trends, price levels, and market phases – the very power of making sound trading decisions.
How to Read Cryptocurrency Charts
The Basics of Cryptocurrency Markets
First, before you dive headfirst into chart analysis, it would be beneficial to have a little background on how the cryptocurrency market works. Any asset will have its price, whether it be cryptocurrencies or stocks. That price will be determined by historical events which can be built upon in today’s market conditions and future expectations. The creation of these elements will help frame your view of price movements and market trends.
Market Principles
Charles Dow said the price of a security embodies all known news. Hence it often repeats past price patterns that prevail to predict the next future moves. In addition, the market has trends which are provided upward, or bull market, downward, or bear market, or sideways, or consolidation. This means that understanding the above trends is very important to understand how to read cryptocurrency charts successful trading.
What is Crypto Chart?
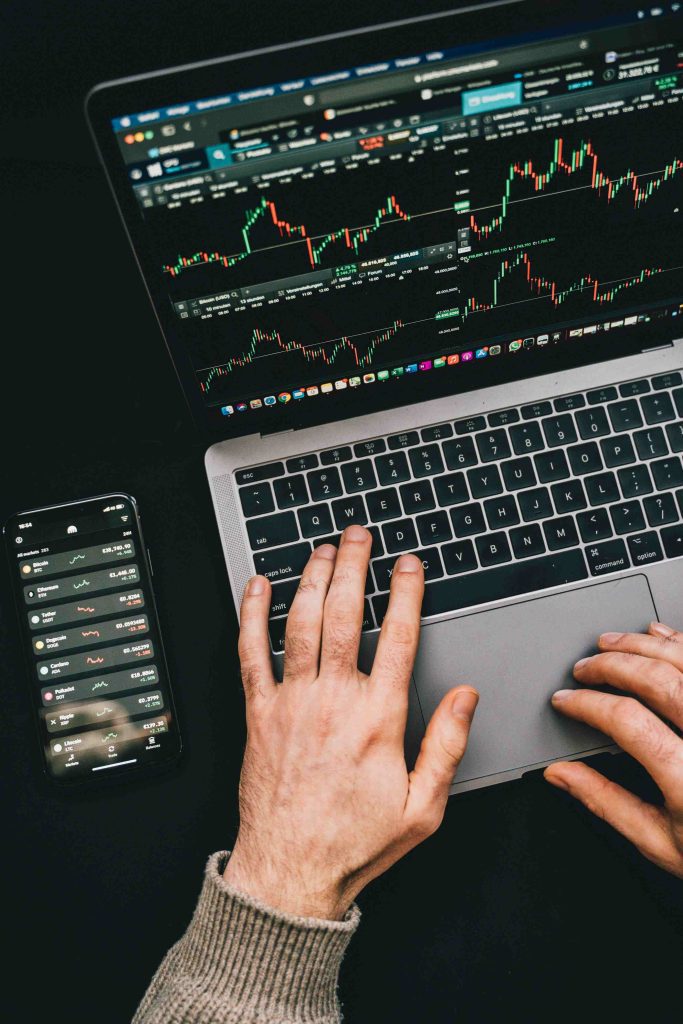
A cryptocurrency chart is a representation of the movement of the prices of a particular coin over time. Using this chart, optimal price to buy, potential upside, and for how long an asset should be kept can be obtained. There are several types of charts; probably the most informative type is that of Japanese candlestick charts.
To understand how to read cryptocurrency charts, first learn about charts.
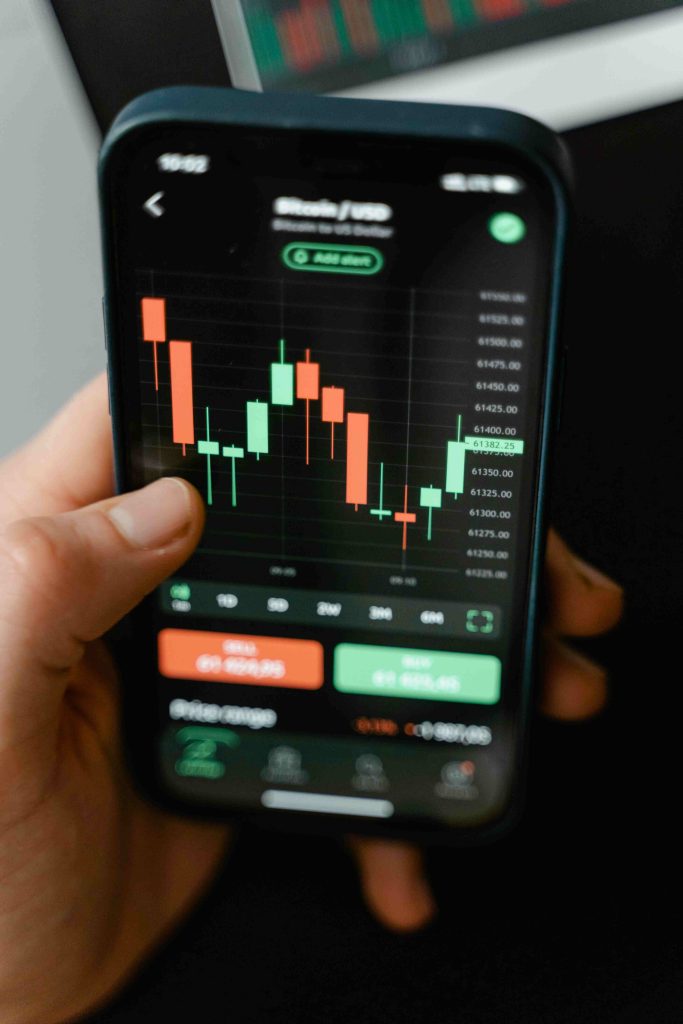
Candlestick Charts Explained
Candlestick Charts show the direction of price movement over time, guiding investors with their decisions. Each candlestick contains the following information:
The Opening Price: It represents the initial market sentiment. It is the price at which the first transaction occurred within the defined time frame, as in the opening of a trading day or month.
Closing Price: It indicates the closing sentiment of the market. It presents the price of the last transaction in a given time cycle, such as the last trade of the day or the last trade of the quarter.
The Body: A filled area of the candlestick is a direct representation of the range between the opening and closing prices. A green body looks like the rising sun, representing that the price has gone up, which means there must be powerful bull forces in the market. A red body indicates a downward arrow, signifying that the price has gone down or that the market has bearish sentiments.
Shadows: They are also called wicks. They plot both sides of the body clearly showing on the chart at which the highest and lowest points are reached within the selected time. These shadows can be long and slender if prices have varied much or short and stubby in case of a stable market environment.
Understanding Time Frames
Proper time frames are used to observe the right movement of prices and to understand how to read cryptocurrency charts. They indicate the period within which price movements happen. Important time frames include the following:
- Minute Charts: M5, M15, M30 (5, 15, and 30 minutes)
- Hourly Charts: H1, H4 (1 and 4 hours)
- Daily Charts: D1 (one day)
- Weekly Charts: W1 (one week)
The different time frames make it possible for the traders to see long-run trends and short-term deviations.
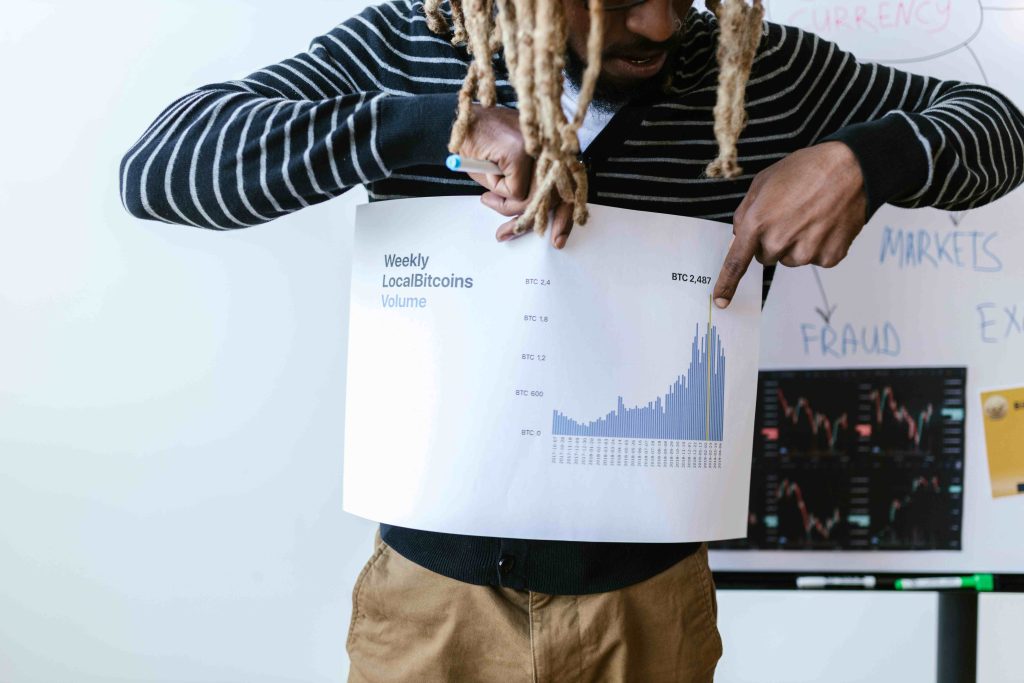
Trading Volumes Analysis
To learn how to read cryptocurrency charts it is important to learn about trading volumes. It is the number and size of transactions within a given time period. Trading volume analysis is always crucial in qualitative analysis, since it determines the direction of market interest in specific cryptocurrencies. With high volumes, movements are often validated, and liquidity is significant, which is an implication that assets can be sold easily.
Trading volume generally appears as vertical bars underneath the price chart of a candlestick chart. In this case, each bar represents a specific time frame, and the volume traded will be reflected by the height of the bar. For example, a red bar generally shows that more selling is going on than buying is, while a green bar shows that more buying is going on than selling.
Understanding Trends in Cryptocurrency Markets
Trends are very significant in the understanding of price movements within the currency. A trend is defined as a persistent process or vector in which a particular currency is moving and during this path, each successive high and low occurs higher in an uptrend or lower on a downtrend. Trends can be categorized under any of the following:
- Uptrend or Bull Market Prices are rising
- Downtrend or Bear Market Prices are falling
- Sideways or Consolidation Prices are stable and lacking major moves.
Types of Trends
- Primary Trend: Long-term trend over one year.
- Secondary Trend: Medium-term trend three weeks to three months.
- Minor Trend: Short-term fluctuations less than three weeks.
According to Dow’s theory, “multiple trends can exist simultaneously at different levels”:
Phases of the Cryptocurrency Market
The market of cryptocurrency has different phases, each of which is characterized by distinctive market behavior. With this knowledge of these phases, it will be much easier to learn how to read cryptocurrency charts for you to trade effectively.
Market Phases
Major stages include:
Accumulation Phase: Significant investors are said to accumulate positions towards the end of a downtrend, which often manifests on the charts as a long horizontal trend.
Public Participation Phase: The rally is now more pronounced with high trade volumes, and positive coverage in the press.
Access Phase: Seasoned traders close their longs while new investors begin accumulating with the intent to buy, and this usually results in price reversal.
Price Levels: Supports and Resistances
Knowing the levels of support and resistance is very crucial in coming up with good trades. A support level is that price area that has been the location of a historical change of direction or slowing in the market, while a resistance level is a level, to date, the price of an asset has not been able to surpass.
Support Level: The level at which an asset tends to stop falling and bounce back upward is called its support level. That is, it is where there is a strong buying interest in that price level.
Resistance Level: The level of resistance is the price at which an asset tends to stop its upward movement and then turns downwards. This indicates that there is still strong selling pressure at that specific price level.
Role Reversal: Support and resistance levels switch roles. Once a break to the upside is made in a resistance level, it can be considered a support level from then onwards, and vice versa.
Conclusion
Learning how to read cryptocurrency charts is something no trader should be ignorant about. Trading market principles, candlestick patterns, trading volumes, trends, market phases, and price levels decide your every trading move. Learn diligently and never forget to practice under live market conditions. Eventually, with time and experience, you will become perfect at reading and deciphering cryptocurrency charts just like pros.
You May Like: What is DeFi Crypto Trading and Investing Strategies
You May Also Like: Top 10 Cryptocurrency Business Ideas for 2024